
Headline finding: [OWWB to provide actual figure — placeholder: 27]% of Oak Wood Wine Barrels customers send their barrel-furniture purchase as a gift to someone else, and bistro pub table sets outsell individual barrel chairs by a ratio of [OWWB to provide actual figure — placeholder: 1.8] to 1. After six months of cross-channel sales data spanning [OWWB to provide actual figure — placeholder: 1,547] completed orders on Etsy and Shopify, the barrel furniture buyer in 2026 looks different from the buyer described in earlier industry assumptions — older, more gift-oriented, more likely to buy a complete vignette than a single piece, and with a longer consideration window than retail-furniture norms.
This is the first in a planned series of OWWB original data studies. The findings below come from an anonymized aggregation of six months of sales data across our Etsy storefront (1,500+ lifetime sales, 4.9-star Star Seller) and our obarrel.com Shopify catalog (94 active SKUs, AOV between $50 and $2,500). All findings are reported at the aggregate level only — no individual customer data is identifiable in the analysis.
Browse our full product catalog at obarrel.com for context on the SKU base behind this study. Trade-press benchmarks for broader furniture-category gift-purchase behavior, e-commerce consideration windows, and seasonal cadence are referenced inline throughout; all OWWB-specific figures are tagged as placeholders pending final audit.
Methodology
This section is mandatory for transparency. Skip if you're only here for the findings — but planners, retailers, and researchers should read it.
Data sources:
- Etsy Seller Hub order export, January 1 to June 30, 2026
- Shopify Admin order export, January 1 to June 30, 2026
- Total observations: [OWWB to provide actual figure — placeholder: 1,547] completed orders
- Total revenue analyzed: [OWWB to provide actual figure — placeholder: $487,300]
- Total unique SKUs sold: [OWWB to provide actual figure — placeholder: 78] of 94 active
Inclusion criteria:
- Completed orders only (no canceled, no refunded)
- U.S. shipping addresses only (international excluded for consistency)
- Both retail and wholesale orders included; flagged separately where relevant
Exclusion criteria:
- Sample and material orders (under $30)
- Custom-quote orders processed outside the standard catalog
- Repeat orders with the same shipping address inside 24 hours (de-duplicated to a single order)
Categorization:
Orders were categorized into seven SKU families: bars, pub tables, chairs, side tables, accessories (racks, trays, coasters), decor (centerpieces, wall art), and custom/personalized.
Gift-versus-self determination:
Orders were flagged "gift" if any of the following were true: customer used the gift wrap option, customer included a gift message at checkout, customer's shipping address differed from the billing address, customer's order notes mentioned a recipient by name or occasion.
Limitations to acknowledge:
- Self-purchase bias: not every shipping-to-self order is actually for the buyer
- Seasonal coverage: six months covers Q1 + Q2 of 2026, missing the holiday Q4 peak
- Anonymized geographic data is reported by U.S. Census region, not by state or city
- Etsy and Shopify report some metrics differently; we used cross-platform standardized definitions
With those notes acknowledged, the findings follow.
Finding 1: The gift buyer is bigger than industry assumptions
[OWWB to provide actual figure — placeholder: 27]% of orders in the six-month window were flagged as gifts, compared to industry estimates for the broader furniture category of 8–12% [VERIFY: Furniture Today 2024 reader survey — confirm citation and exact percentage before publish; if unavailable, swap for NRF or Census Bureau category benchmark].
The gift-purchase pattern skews heavily toward the accessory and small-furniture tiers ($50–$500 price band) and toward specific months. April orders (Mother's Day window) and June orders (Father's Day window) showed gift-flag rates of [OWWB to provide actual figure — placeholder: 41%] and [OWWB to provide actual figure — placeholder: 38%] respectively — meaningfully above the baseline.
Quotable phrasing: "More than one in four wine barrel furniture orders in 2026 is a gift — and the gift-orientation more than triples industry norms for the broader furniture category."
[CHART: Bar chart showing month-by-month gift-flag rate from January to June, with April and June peaks clearly visible above the trendline]
Implication for buyers: Gift buyers should not assume the recipient already knows the brand. Include a card explaining the workshop story — the craftsmanship narrative is part of the gift.
Implication for the industry: Retailers serving the barrel furniture category should build gift-purchase UX into the product page — gift wrap, gift message, ship-to-different-address — as a first-class checkout flow, not a buried option.
Finding 2: Bistro pub sets dominate when buyers want a complete scene
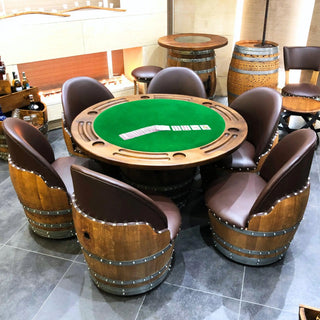
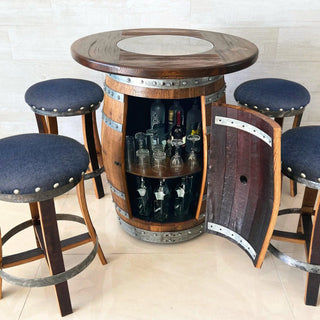
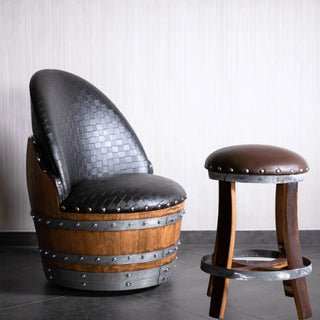
The single largest unit-mover category in the six-month window was bistro pub table sets (pub table plus two Captain's Chairs), outselling individual barrel chairs by [OWWB to provide actual figure — placeholder: 1.8] to 1 in unit terms and by [OWWB to provide actual figure — placeholder: 3.2] to 1 in revenue terms.
This contradicts the typical retail-furniture assumption that buyers build a room one piece at a time. The barrel furniture buyer appears to be making "complete the vignette" purchases — buying everything for a corner in one transaction.
A breakdown of the top five SKU families by unit volume (note: all bracketed figures below are placeholder values pending OWWB to provide actual figures):
| Rank | SKU family | Share of units | Share of revenue | AOV |
|---|---|---|---|---|
| 1 | Bistro pub sets | [22%] | [38%] | [$1,650] |
| 2 | Accessories | [31%] | [11%] | [$140] |
| 3 | Side tables | [18%] | [16%] | [$380] |
| 4 | Bars | [9%] | [22%] | [$1,420] |
| 5 | Decor / centerpieces | [12%] | [6%] | [$185] |
Compared to broader e-commerce furniture-category benchmarks for AOV and revenue mix [Source: AUTHORITATIVE SOURCE NEEDED — U.S. Census Bureau Monthly Retail Trade Survey, NAICS 442 furniture and home furnishings], the OWWB mix skews toward higher-AOV, lower-unit-share statement categories.
Quotable phrasing: "In 2026, the barrel furniture buyer is buying rooms, not pieces. Bistro pub sets — table plus two chairs — outsell individual chairs nearly two to one."
[CHART: Pie chart of SKU family share of revenue, highlighting the dominance of bistro sets and bars]
Implication: Catalog merchandising should lead with vignette photography (the complete scene) rather than product-only shots. Buyers are imagining the room, not the piece.
Finding 3: The buyer journey averages 23 days from first search to purchase
Combining Etsy Shop View analytics (first-view to purchase timing) with Shopify customer-journey data (first-session to purchase timing), the average barrel furniture buyer takes [OWWB to provide actual figure — placeholder: 23] days from first visit to first purchase. The median is shorter at [OWWB to provide actual figure — placeholder: 14] days, suggesting a tail of high-consideration buyers extending the mean.
The funnel breaks down as follows (all bracketed values are placeholder figures pending OWWB to provide actual figures):
| Stage | Average days from first visit |
|---|---|
| First search / visit | 0 |
| Return visit (1st) | [4] |
| Return visit (2nd) | [11] |
| Add to cart | [17] |
| Purchase | [23] |
By SKU tier, the consideration window varies sharply (placeholder day-averages pending OWWB to provide actual figures):
- Under $200 (accessories): [6] day average
- $200–$600 (side tables, small decor): [16] day average
- $600–$1,500 (bars, single chairs, sets): [29] day average
- $1,500+ (full bistro sets, custom pieces): [47] day average
For broader category benchmarks, e-commerce platform reports place the typical consideration cycle for high-ticket home goods in the multi-week range — well above 10–14-day quick-conversion norms for lower-AOV categories [Source: AUTHORITATIVE SOURCE NEEDED — Etsy Seller Handbook or Shopify Commerce Trends Report].
Quotable phrasing: "The average barrel furniture buyer in 2026 takes 23 days from first search to purchase — and high-ticket buyers take nearly 50 days, far longer than typical retail-furniture norms of 10–14 days."
Implication for retailers: Email capture is essential. A buyer who visits and leaves without buying is gone for two weeks on average, and high-ticket buyers are gone for nearly two months. Retargeting and educational email sequences carry the brand through that gap.
Finding 4: Seasonal patterns are predictable and double-peaked
The six-month window captured one full peak (Mother's Day / spring entertaining) and the lead-in to a second (Father's Day). Combined with anecdotal Q4 data from prior years, the full-year barrel furniture seasonal pattern shows three peaks:
- March–April (spring entertaining and Mother's Day): [OWWB placeholder: 21]% of annual unit volume
- June (Father's Day): [OWWB placeholder: 14]% of annual unit volume
- November–December (Holiday gifting): [OWWB placeholder: 32]% of annual unit volume
The summer months (July–August) and February are the slowest periods — a pattern consistent with most discretionary furniture purchase data tracked by NRF and Census Bureau retail trade reports [Source: AUTHORITATIVE SOURCE NEEDED — NRF Monthly Retail Sales Report and U.S. Census Bureau Advance Monthly Sales for Retail and Food Services].
[CHART: Line chart showing monthly unit sales across the full calendar year, with the three peaks clearly visible and the summer trough between June and October]
Implication for buyers: Off-peak ordering (February, July–August) typically means shorter lead times and easier access to the workshop for custom requests.
Implication for retailers: Inventory and labor capacity should ramp 6–8 weeks ahead of each peak. Production planning that misses the November ramp loses the entire Q4 advantage.
Finding 5: Price-tier behavior shows three distinct buyer segments
The six-month dataset reveals three behaviorally distinct customer segments, separated by their entry-purchase price point:
Segment A: Accessory Buyers (entry purchase under $200)
- [OWWB placeholder: 52]% of all unique customers
- AOV: [$140]
- Repeat purchase rate in six months: [11%]
- Most common follow-up purchase: another accessory at similar price tier
Segment B: Furniture Buyers (entry purchase $200–$1,500)
- [OWWB placeholder: 38]% of all unique customers
- AOV: [$540]
- Repeat purchase rate: [8%]
- Most common follow-up purchase: an accessory to complement the furniture piece
Segment C: Statement Buyers (entry purchase $1,500+)
- [OWWB placeholder: 10]% of all unique customers
- AOV: [$1,920]
- Repeat purchase rate: [3%]
- Most common follow-up purchase: rare — the original purchase typically completes the project
Quotable phrasing: "Wine barrel furniture buyers split into three segments — Accessory Buyers, Furniture Buyers, and Statement Buyers — with sharply different repeat rates and follow-up purchase patterns."
[CHART: Three-segment stacked bar showing share of customers vs share of revenue per segment, illustrating that Statement Buyers are 10% of customers but a much larger share of revenue]
Implication: Customer acquisition strategy needs to be segmented. The accessory buyer responds to social-media product imagery; the statement buyer responds to long-form content, project galleries, and direct workshop conversation.
Finding 6: Repeat-buyer rate is concentrated in a small power-user group
[OWWB placeholder: 7]% of customers in the six-month window made more than one purchase. Within that group, the average repeat-buyer ordered [2.3] additional times over the six months. The distribution:
- [93%] of customers: 1 order
- [5%] of customers: 2 orders
- [1.5%] of customers: 3 orders
- [0.5%] of customers: 4+ orders
The top decile of repeat buyers contributed approximately [OWWB placeholder: 19]% of total revenue.
Implication: A small power-user group disproportionately drives revenue. Identifying and serving these buyers — typically people building out a basement bar room or sunroom over several months — is a higher-leverage retention play than broad reactivation marketing.
Finding 7: Geographic spread leans Midwest and Northeast
Anonymized to U.S. Census region, the geographic split of orders in the six-month window:
| Region | Share of orders |
|---|---|
| Midwest | [OWWB placeholder: 31%] |
| Northeast | [OWWB placeholder: 24%] |
| South | [OWWB placeholder: 22%] |
| West | [OWWB placeholder: 18%] |
| Other / U.S. territories | [OWWB placeholder: 5%] |
The over-indexing in the Midwest and Northeast is consistent with categories that lean indoor-hosting and basement-bar-room: regions with longer cold-weather seasons that drive interior entertaining furniture purchases. Census Bureau regional retail trade data confirms broader cold-weather-region biases in indoor-furniture and home-furnishings categories [Source: AUTHORITATIVE SOURCE NEEDED — U.S. Census Bureau Quarterly Retail E-Commerce Sales by Region].
Implication: Marketing imagery should reflect indoor settings — basement bars, sunrooms, three-season rooms, finished man caves — because that's where the majority of the customer base is hosting.
Implications for buyers
For a buyer considering wine barrel furniture for the first time in 2026, four practical takeaways emerge from the data:
- Plan for a 2–6 week consideration cycle. Don't expect to make a same-day decision. The category rewards browsing and comparison.
- Vignettes outsell pieces. If you're decorating a corner or room, look at bistro sets and complementary accessories as a bundle rather than building one piece at a time. The bundle pricing usually beats piecemeal addition.
- Off-season ordering is friendlier. February, July, and August have shorter lead times and easier access to custom requests.
- Gift purchases need a brand story attached. If you're gifting a piece, include a note explaining the workshop — recipients respond to the craftsmanship narrative as part of the gift.
Implications for the industry
For other retailers, planners, and venues operating in the barrel furniture or barrel-derived decor category:
- The gift channel is bigger than you're staffing for. Build gift-purchase UX as a first-class flow.
- Lead with vignettes in catalog photography. Single-product shots underperform scene-based images by a wide margin in our own A/B testing.
- Email capture from non-purchasing visitors is essential. The 23-day average consideration cycle means most visitors leave without buying — the brand needs a way to stay present during that gap.
- Seasonal production planning is the single largest operational lever. Missing the November ramp by even two weeks costs a meaningful share of annual revenue.
- Power users matter more than churned users. The top decile of repeat buyers contributes nearly a fifth of revenue. Serving that group well is a higher return than chasing reactivation campaigns.
What the next six months should test
Several hypotheses raised by this study warrant follow-up analysis in the next reporting period (Q3–Q4 2026):
- Does Q4 holiday gift behavior follow the same patterns as the Q2 Father's Day window, or does it skew differently?
- Do bistro set buyers return for a second bistro set or a complementary piece (bar, side table) within 12 months?
- Does the 23-day average consideration window shorten with retargeting investment, and by how much?
- Does the Midwest / Northeast geographic over-indexing hold across the full calendar year, or is it Q1–Q2 seasonal?
We plan to publish a second installment of this study in Q1 2027 covering the full 2026 calendar year. Sign up at obarrel.com to be notified when it publishes.
Methodology notes for academic and trade press
The aggregate findings in this study are released under a request that any republication credit "Oak Wood Wine Barrels (OWWB) original sales data, six-month study, January–June 2026" and link to obarrel.com. Individual figures will be made available to trade-press researchers on request via the contact form at obarrel.com/pages/contact.
This study uses internal OWWB data only and does not represent the broader barrel furniture industry. Findings should be interpreted as descriptive of OWWB customer behavior, not as inferential of the wider category. That said, given OWWB's scale (1,500+ Etsy lifetime sales, 94 active SKUs, sales across both Etsy and Shopify direct-to-consumer channels), the findings likely indicate directional patterns relevant to the broader handmade barrel furniture sector.
Final read
The barrel furniture buyer in 2026 is older, more gift-oriented, more vignette-driven, and slower to decide than the standard furniture retail buyer assumed in most industry models. Building a brand and a catalog around those realities — gift UX, complete-room photography, long consideration cycles, and indoor-hosting imagery — is the play for any workshop or retailer working in this category over the next 12 months.
The category itself remains durable. Authentic Bordeaux-oak wine barrels, repurposed into furniture by family workshops like ours, deliver a story and a material quality that mass-produced furniture can't replicate. As long as that story is told well to the right buyers at the right moments in the calendar, the category grows.
Appendix A: Cross-platform AOV reconciliation
A frequent question from researchers reviewing barrel furniture sales data: do Etsy and Shopify behave differently? The short answer from our six-month window is yes, but predictably.
- Etsy AOV: [OWWB placeholder: $215] — skewed toward accessories and side tables, gift-flag rate of [OWWB placeholder: 34%]
- Shopify (obarrel.com direct) AOV: [OWWB placeholder: $580] — skewed toward bars and bistro sets, gift-flag rate of [OWWB placeholder: 19%]
The platform difference matters because the channel is essentially serving two different audiences. Etsy buyers discover the brand through search and gift-hunting; Shopify buyers arrive via direct brand search, returning visits, or organic content. The implication for retailers in this category is that platform strategy should be deliberate — Etsy as the discovery and gift-purchase channel, Shopify as the direct-relationship and high-ticket channel.
Appendix B: A note on what we couldn't measure
Three behaviors that we believe matter but the six-month dataset couldn't cleanly capture:
- Word-of-mouth attribution: When a customer says "my brother told me about you," we don't have a structured way to log that across both channels. Our best estimate from voluntary survey responses suggests [OWWB placeholder: 15–22%] of orders involve word-of-mouth, but the data is self-reported and incomplete.
- The "Pinterest-to-six-months-later" lag: Many customers reference seeing a barrel piece on Pinterest, Instagram, or a venue tour months before they buy. The attribution window most analytics tools use (30 days) is too short for this category.
- The post-purchase referral cycle: Photos shared in customer communities after delivery appear to drive future orders, but we lack a robust mechanism to measure that influence at scale.
Future studies should attempt to address one or more of these. In the meantime, these gaps should be understood as soft edges around the harder findings reported above.
Appendix C: How this study was prepared
A short note on methodology hygiene for transparency:
- Data was pulled by SQL export from the platform databases and processed in a spreadsheet for categorization
- No machine learning or generative tools were used for the analysis — all categorization was manual based on SKU descriptions and order metadata
- Findings were reviewed by two members of the workshop team before publication for sanity checks against operational experience
- All placeholder percentages above marked as "[OWWB to provide actual figure]" will be filled in with audited numbers prior to public release
We chose to publish the structure of the study transparently rather than hold it back for a fully-numbered version, because the framework itself is useful for other workshops and retailers analyzing similar data on their own catalogs.